What's inside TradingLabs App?
- Dec 22, 2025
- 3 min read
In this article, let's have a look at the tools that TradingLabs App has to offer.
Dashboard
Starting with the Dashboard, this app offers various information from basic data, such as the account login number, balance, and equity, up to more advanced indicators such as the win rate, risk/reward, expectancy, and many more. Let's break down each section in detail below:

A. Period switcher
This feature in the Dashboard App will filter out the Dashboard statistics according to the chosen timeframe. You can either choose to evaluate for All trades (MAX), Last 365 days (Y), Last 90 days (Q), Last 30 days (M), Last 7 days (W), or Today’s trades (D).

B. Symbol filter
This feature in the Dashboard App will filter out the Dashboard statistics according to the instruments chosen. You can choose one or multiple symbols that you traded on your trading account to see the statistics on that particular symbol. This is especially useful when you are testing on a particular set of instruments (Metals, Indices, FX, etc.)

C. Account info
This section will show you basic information about your trading account, such as the Login, Balance, Equity and Free Margin.

D. Net P&L
This section will display the total Net P&L for the chosen time period and set of symbols.

E. Winrate
This section will show you the winrate in percentage calculated by the total number of winning trades divided by the total number of trades. All necessary information for the calculation of the winrate is also included in this section.

F. Statistics
In this section, we can find basic statistical information about the trading activity, such as the Average Win, Average Loss and Expectancy defined in monetary terms. Risk/Reward is also displayed based on the average win versus average loss.

G. Balance Curve
The balance curve allows us to visually analyse the balance progression on a line chart within the defined time.

H. P&L Curve
The P&L curve allows us to visually analyse the profit or loss progression on a line chart within the defined time.

I. Trading Frequency
Trading frequency shows us how often we trade, the number of trades separated by days within the defined time.

J. Recent Trades
Recent trades is the table of historical trades on the account. It also displays the trades within the defined timeframe at the top of the dashboard. The table consists of columns such as Symbol, Direction, Volume, Commission, Swap, and Net P&L.

K. Buy/Sell Profit Summary
This shows whether Buy or Sell positions are dominating the P&L summary of the trades.

Journal
Another tool that is an integral part of trading is the trading journal. It helps the trader keep track of the mental and psychological side of trading, which as a result has a direct positive impact on the long-term consistency.

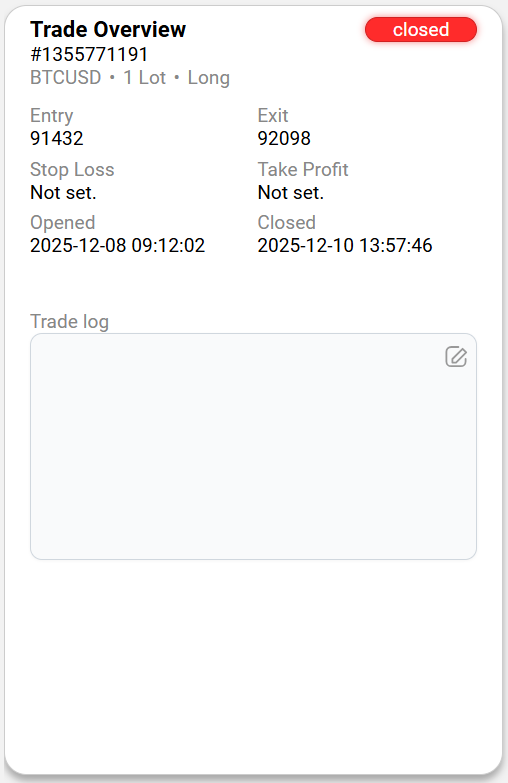
a. Trade Overview
Trade Overview is the section with basic information about a trade selected from the Trades table below. It contains Entry price, Exit price, Stop Loss, Take Profit, Open Date Time and Close Date Time of the particular trade. In this section, Trading log is available for traders to create their own inputs as in a classical journal.
b. Trades
Trade Overview is the section with basic information about a trade selected from the Trades table below. It contains Entry price, Exit price, Stop Loss, Take Profit, Open Date Time and Close Date Time of the particular trade.

c. Trading Chart
Trading Chart serves for visualization of the trade selected from the Trades table below.

Settings
Lastly, we have the settings. Although this is not a feature, it is worth mentioning that in case you have multiple MT5 platforms on your computed and wish to switch to a different one, you can do so in this section. Just change the path, save it, and restart the whole app.


